Documentation
VT Planner Results Guide
Guide to reviewing VT Planner run history, statuses, embedded reports, calculation metrics, simulation metrics, multi-run results, comparisons, and PDF export.
The Results tab contains the run history and the detailed view for each result.
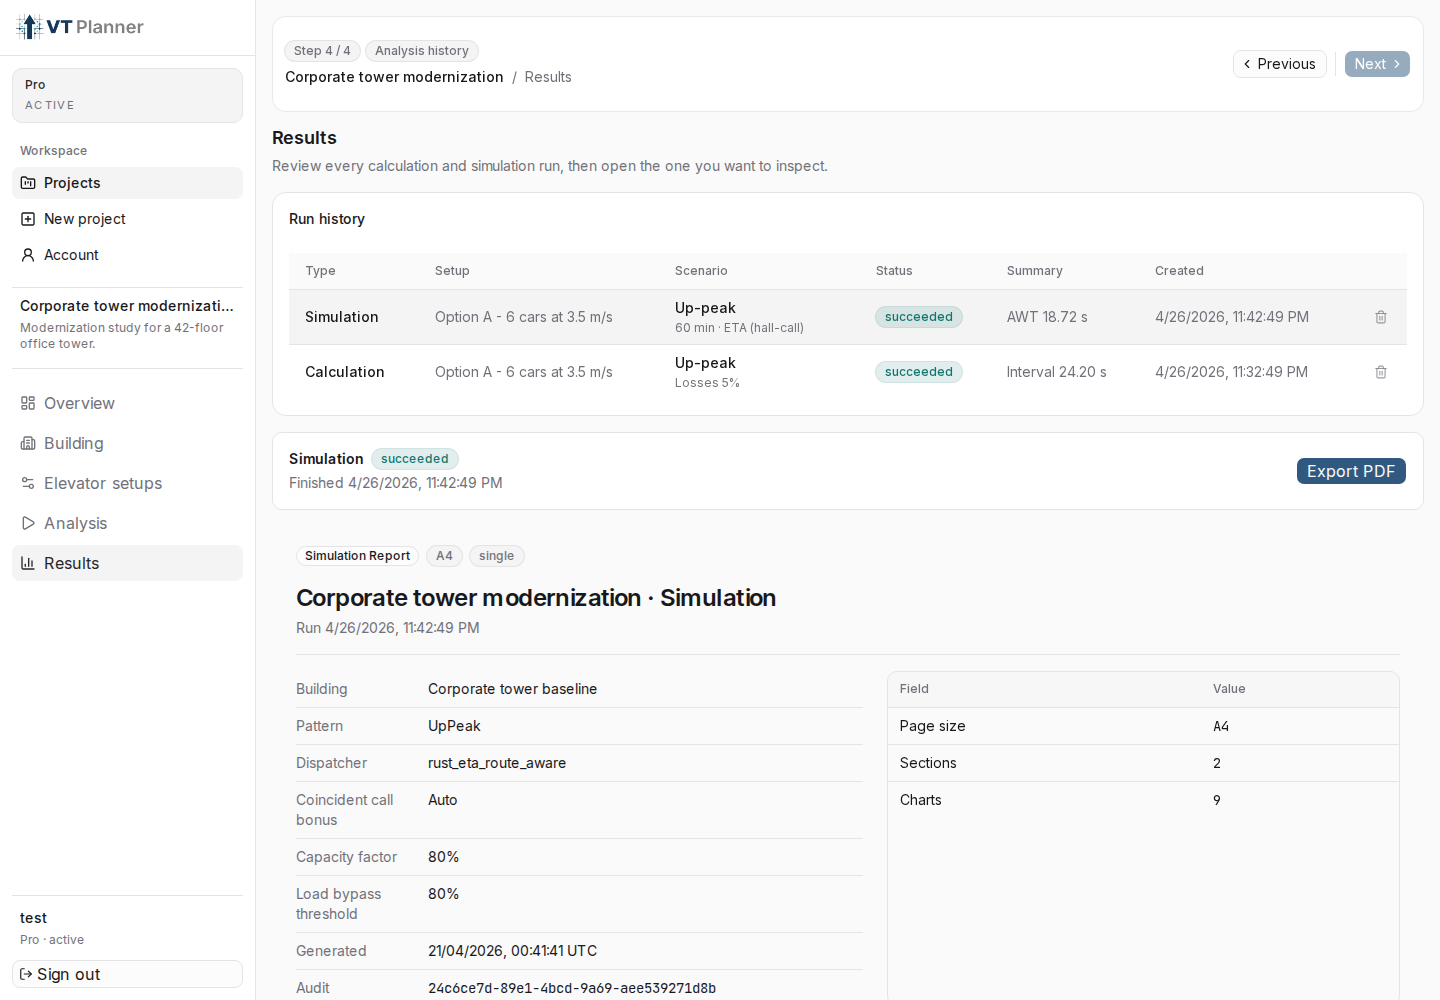
Run history table lets you open previous runs and compare status, scenario, and summary.Run history
The table shows:
Type: executed analysis type.Setup: elevator setup used.Scenario: method, traffic pattern, dispatcher, or duration.Status: run status.Summary: main summary.Created: creation date.
Select a row to open its details.
Statuses
queued: the run is waiting for execution.running: the run is in progress.succeeded: the run completed and has results.failed: the run completed with an error.
If a run fails, VT Planner shows the available message in the detail view.
Embedded Report
When you select a completed run, VT Planner builds the report view inside the page. Depending on the analysis type, it may include:
- executive summary;
- case data;
- building;
- elevator group;
- scenario;
- main metrics;
- per-run tables;
- charts;
- simulation replay when applicable.

Export PDF action.Reading Metrics
Use the report as a structured review, not as a single pass/fail number. First confirm the Setup and Scenario, then read the metrics that match the analysis type.
Calculation Metrics
Calculation results focus on sizing and consistency checks:
| Metric | How to read it |
|---|---|
RTT |
Round trip time for a representative car cycle. It is a useful first check for group sizing and for explaining why interval and handling capacity move. |
Interval |
Average separation between group departures or services. Lower interval usually means shorter expected waits, but it should be reviewed with waiting time and capacity. |
Handling capacity |
Passengers moved in a reference five-minute window, also shown as a percentage of population. |
Average waiting, transit, and journey |
Passenger experience estimates. Journey combines waiting and in-car movement, plus final alighting where applicable. |
Average occupancy and capacity factors |
Cabin load indicators. Use them to see whether a result is relying on heavy car loading, not only on speed or car count. |
Compliance |
Compares interval, handling capacity, and waiting time against the selected basis. In General analysis, these checks may be informational rather than a final compliance decision. |
Simulation Metrics
Simulation results show passenger outcomes over time:
Completion rate: percentage of generated passengers completed during the simulated window.Average interval: observed average interval during the run.Average waiting,transit, andjourney: passenger time metrics from the simulation.Metric Table: distribution summary withAverage,Std dev, and percentiles such asP50,P90,P95, andP99.Window averages: compares the full0-60 minwindow with the trimmed5-55 minwindow when available.- Charts: use queue length, interval profile, and time distributions to detect instability that a headline average can hide.
Multi-run Metrics
Multi-run simulation summarizes variability across repeated simulation runs:
- use the mean values to compare central tendency;
- use confidence intervals to judge how stable the estimate is;
- review convergence status before relying on small differences between alternatives;
- check per-run results when two setups are close, because one seed can make a single simulation look better or worse than the repeated-run estimate.
For parameter sweeps, the result tables are ranked for quick scanning. Calculation batch prioritizes lower interval and higher handling capacity. Simulation batch prioritizes lower waiting time, then interval, then completion.
Export PDF
Use Export PDF to generate a downloadable report for the selected run. The button is available when the result has a supported report view.
If the button shows Generating PDF, wait for generation to finish before changing runs.
Compare Results
To compare alternatives:
- use clear setup names;
- keep notes in
Setup details; - review
Scenarioto confirm that execution parameters are comparable; - use batches or
Parameter sweepwhen you want to compare many variants systematically; - avoid comparing runs with outdated buildings or setups.
Delete Runs
The delete action removes the run from the project history. Use it only when the result should no longer be part of the study.