Documentation
VT Planner Traffic Demand Guide
Guide to VT Planner elevator traffic patterns, built-in demand profiles, custom simulation demand, and the Demand used panel before launch.
Traffic patterns translate a scenario into demand intensity. In VT Planner, demand is expressed as a percentage of building population per 5 minutes, split into:
- incoming traffic;
- outgoing traffic;
- interfloor traffic.
The Demand used panel in Analysis is the best place to verify the resolved numbers before launching a run.
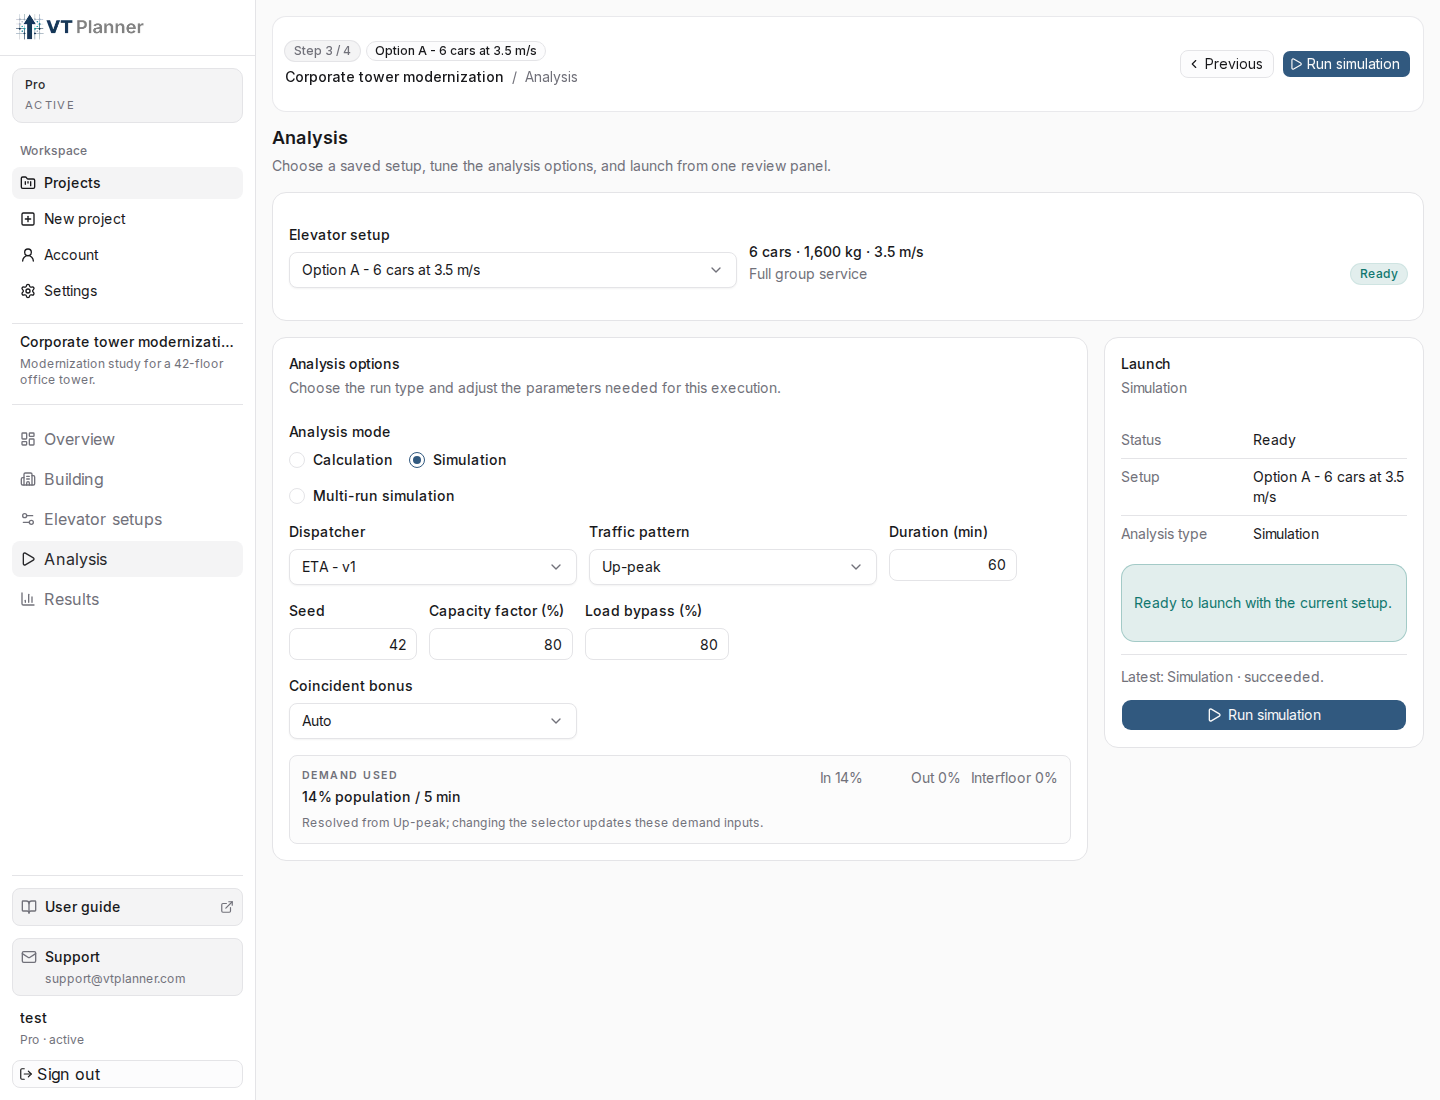
Up-peak office simulation, Demand used resolves the total and directional split before launch.Built-in Patterns
Built-in simulation patterns resolve to these demand profiles:
| Traffic pattern | Incoming | Outgoing | Interfloor | Total |
|---|---|---|---|---|
Up-peak |
12% | 0% | 0% | 12% |
Down-peak |
0% | 12% | 0% | 12% |
Interfloor |
4% | 4% | 4% | 12% |
Mixed |
6% | 3% | 3% | 12% |
Midday / Lunch |
9% | 9% | 2% | 20% |
Up-peak can be adjusted by Building type: Office uses 14% incoming demand and Residential uses 7.5% incoming demand. Other built-in up-peak cases use the built-in profile shown above.
Choosing a Pattern
Use the pattern that matches the passenger movement being tested:
| Scenario | Recommended pattern | Reason |
|---|---|---|
| Morning arrival pressure | Up-peak |
Tests lobby-to-floor demand and group departure capacity. |
| End-of-day evacuation toward exits | Down-peak |
Tests floor-to-entrance demand and car collection behavior. |
| Internal movement within an occupied building | Interfloor |
Tests non-lobby origin-destination traffic. |
| Normal business-period circulation | Mixed |
Combines incoming, outgoing, and interfloor components. |
| Lunch or strong two-way movement | Midday / Lunch |
Uses a higher total demand with strong incoming and outgoing flow. |
| Project-specific demand assumption | Custom |
Lets you enter the three demand percentages directly. |
Modern buildings should not be reduced automatically to one historical up-peak scenario. Office buildings with flexible schedules, restaurants, meeting floors, mixed-use podiums, parking, or multiple entrances can make midday, two-way, mixed, or custom scenarios more relevant than a pure incoming peak.
Custom Traffic Pattern
Use Custom when the built-in profiles are not the scenario you want to test. After selecting Custom, VT Planner shows:
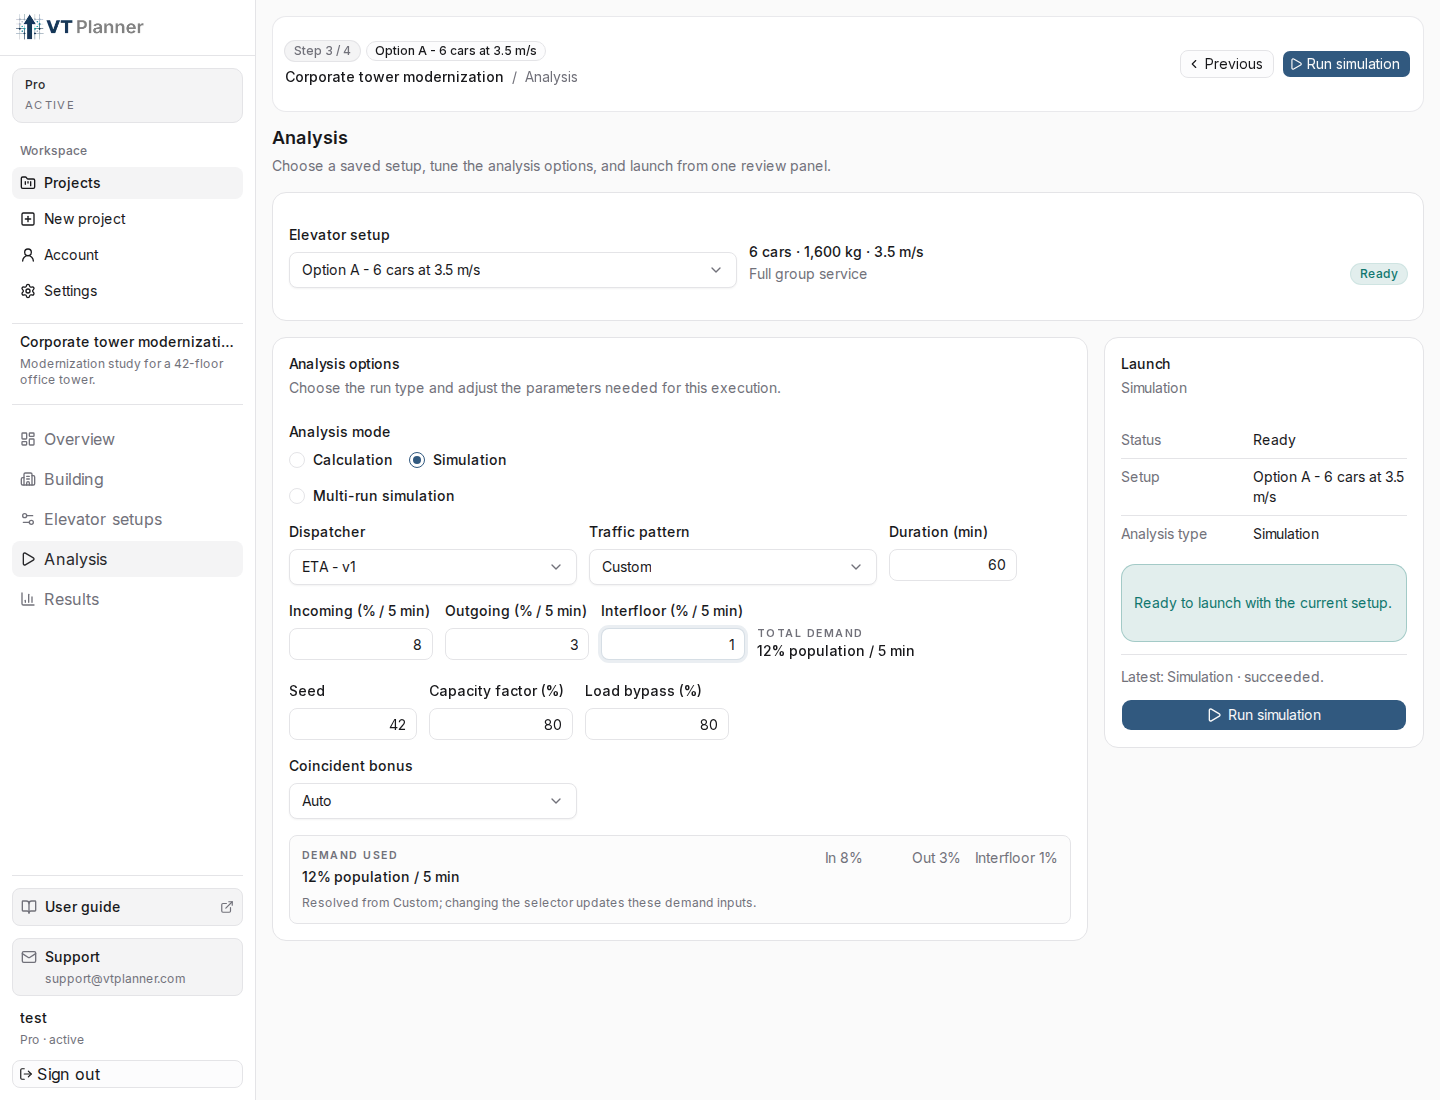
Custom traffic exposes direct incoming, outgoing, and interfloor demand inputs.Incoming (% / 5 min);Outgoing (% / 5 min);Interfloor (% / 5 min);Total demand.
The values are demand intensities, not shares. For example:
| Field | Example | Meaning |
|---|---|---|
Incoming (% / 5 min) |
8.0 |
8% of total population enters through entrance floors over 5 minutes. |
Outgoing (% / 5 min) |
3.0 |
3% of total population travels from occupied floors to entrance floors. |
Interfloor (% / 5 min) |
1.0 |
1% of total population travels between occupied non-entrance floors. |
Total demand |
12.0 |
The total generated demand intensity for the simulation. |
When switching from a built-in pattern to Custom, the interface seeds the custom fields from the selected pattern. This gives you a known starting point instead of a blank profile.
Validation Rules
Custom demand is supported for simulation runs. VT Planner requires:
Custommust have acustomTrafficProfile;- total demand must be greater than
0%; - total demand must not exceed
100% population / 5 min; - built-in patterns should not include a custom profile.
If the custom values fail validation, fix the highlighted demand fields before launching.
Calculation Versus Simulation
Do not confuse custom simulation percentages with General analysis shares.
In Calculation with General analysis, Incoming share, Outgoing share, and Interfloor share must sum to 1.0. They describe the mix of the analytical scenario.
In Simulation with Custom, Incoming, Outgoing, and Interfloor are direct demand percentages per 5 minutes. They do not need to sum to 1.0; they sum to the total demand intensity.
What the Interface Shows
The Demand used indicator shows:
- total demand as
% population / 5 min; - incoming percentage;
- outgoing percentage;
- interfloor percentage;
- the source used to resolve the demand.
Use this panel before launch and then confirm the same assumptions in the result report's passenger data section.
Reports and previews expose the resolved passenger demand context so a reader can see which traffic pattern, demand level, incoming share, outgoing share, and interfloor share were used for the run.